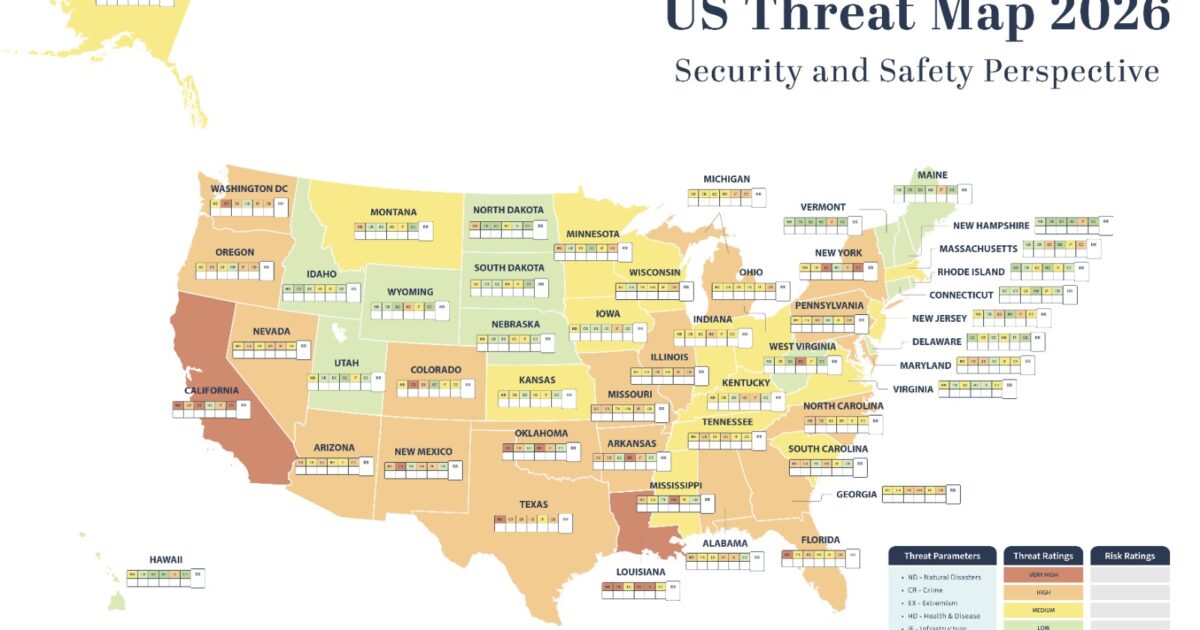
Most threat maps tell you what is happening. The US Threat Map 2026 — published by Datasurfr and powered by MitKat Advisory — goes further: it gives MitKat’s threat rating for every state, then leaves space for you to record what that threat means for your business.
What is the US Threat Map 2026?
A single-sheet, state-level threat map covering the United States from a security and safety perspective, including Washington DC, Alaska and Hawaii. Each state carries a row of ratings across six threat categories plus an overall rating.
What is the difference between threat and risk?
This is the map’s most useful feature. Threat is external and shared: the likelihood and severity of something happening in a given state. Risk is yours alone: what that threat would do to your assets, people and operations. MitKat supplies the threat rating; the blank row beneath each state is where your organisation records its own risk rating for each category, plus an overall rating. Two companies in the same state can face identical threat and very different risk.
Which threats does it measure?
Six categories, abbreviated on the map: ND for natural disasters, CR for crime, EX for extremism, HD for health and disease, IF for infrastructure and CD for civil disturbances. Each is rated separately, so a state can score low on one and high on another.
How is it rated?
Five levels, from very low through low, medium and high to very high, colour-coded per category. State fills give the overall picture at a glance, while the per-category cells show what is driving it.
How should businesses use it?
Fill in the blank row. Take your site list state by state, work through the six categories and record what each threat would cost you — a high natural-disaster rating means little if you hold no fixed assets there, and a medium infrastructure rating can be critical if you run just-in-time logistics. The completed sheet becomes a one-page risk register.
Frequently asked questions
What is the US Threat Map 2026?
A state-level threat map of the United States from Datasurfr, powered by MitKat Advisory, rating every state across six threat categories on a five-level scale, with space for organisations to add their own risk ratings.
What are the six threat categories?
Natural disasters, crime, extremism, health and disease, infrastructure and civil disturbances.
How current is the map?
It was prepared using data and analysis from 2025 and reflects conditions at the time of preparation. Treat it as an annual planning baseline and pair it with current monitoring.
Download the full report now
What is inside
- The US Threat Map 2026 rates every state across six threat categories: natural disasters, crime, extremism, health and disease, infrastructure and civil disturbances.
- Threat ratings run across five levels, from very low to very high.
- A second row is deliberately left blank for each state, so organisations record their own risk ratings alongside MitKat’s threat ratings.
- It is built on 2025 data and analysis, so it is a planning baseline rather than a live feed
Filed under: AmericasRegional Risk Reviews